Dall-E Mini, the AI-powered text-to-image generator has taken over the internet. With its ability to render nearly anything your meme-loving heart desires, anyone can make their dreams come true.
DALL-E 2, a portmanteau of Salvador Dali, the surrealist and Wall-E, the Pixar robot, was created by OpenAI and is not widely available; it creates far cleaner imagery and was recently used to launch Cosmpolitan’s first AI-generated cover. The art world has been one of the first industries to truly embrace AI.
The open-sourced miniature version is what’s responsible for the memes. Programmer Boris Dayma wants to make AI more accessible; he built the Dall-E Mini program as part of a competition held by Google and an AI community called Hugging Face.
And with great technology, comes great memes. Typing a short phrase into Dall-E Mini will manifest 9 different amalgamations, theoretically shaping into reality the strange images you’ve conjured. Its popularity leads to too much traffic, often resulting in an error that can be fixed by refreshing the page or trying again later.
If you want to be a part of the creation of AI-powered engines, it all starts with code. CodeAcademy explains that Dall-E Mini is a seq2seq model, “typically used in natural language processing (NLP) for things like translation and conversational modeling.” CodeAcademy’s Text Generation course will teach you how to utilize seq2seq, but they also offer opportunities to learn 14+ coding languages at your own pace.
You can choose the Machine Learning Specialist career path if you want to become a Data Scientist who develops these types of programs, but you can also choose courses by language, subject (what is cybersecurity?) or even skill - build a website with HTML, CSS, and more.
CodeAcademy offers many classes for free as well as a free trial; it’s an invaluable resource for giving people of all experience levels the fundamentals they need to build the world they want to see.
As for Dall-E Mini, while some have opted to create beauty, most have opted for memes. Here are some of the internet’s favorites:
pic.twitter.com/DbLoe1s00c
— Weird Dall-E Mini Generations (@weirddalle) June 8, 2022
pic.twitter.com/cxtliOrlHz
— Weird Dall-E Mini Generations (@weirddalle) June 12, 2022
no fuck every other dall-e image ive made this one is the best yet pic.twitter.com/iuFNm4UTUM
— bri (@takoyamas) June 10, 2022
pic.twitter.com/rEBHoWR7lH
— Weird Dall-E Mini Generations (@weirddalle) June 12, 2022
pic.twitter.com/RSZaCIDVV7
— Chairman George (@superbunnyhop) June 9, 2022
back at it again at the DALL•E mini pic.twitter.com/iPGsaMThBC
— beca. ⚢ (@dorysief) June 9, 2022
There’s no looking back now, not once you’ve seen Pugachu; artificial intelligence is here to stay.
COVID-19 Part 8: Georgia Sees Increase in Cases and Deaths 3 Weeks After Lifting Lockdown - Sweden Continues Without Clear Downward Trends
The science of COVID-19 explained by a doctor.
By Anthony Lee, MD
Faculty, Harvard Medical School
As we make our way through this pandemic, the large number of cases in the United States has caught our attention and prompted much discussion. In Part 8 of this series, we continue to see The US reliably decline in the number of daily deaths in most areas of the country with at least one exception being Georgia. Sweden has never shown a clear trend in decreasing cases and deaths. We will focus on these locations as they continue to be of interest. As mentioned in previous installments of this series, easing lockdown measures was expected to disrupt downward trends in cases and deaths. Georgia is the best example as they lifted lockdown measures on May 1st and we subsequently have 30 days of data.
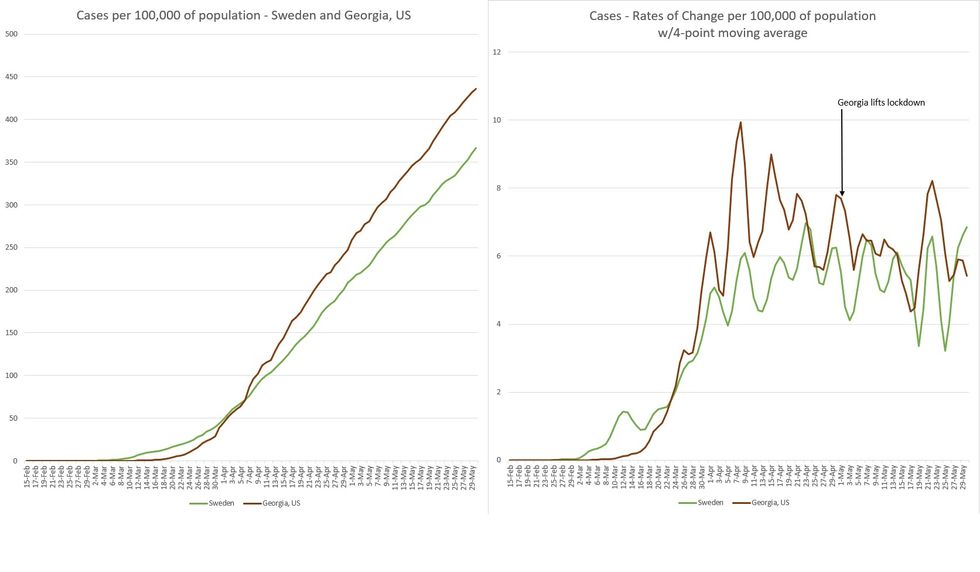
In Figure 1, we see the plots of daily new cases in Georgia and Sweden. On the left we see the cumulative number of cases per 100,000 population, and on the right, the number of daily new cases per 100,000 population. Three weeks after lifting of lockdown measures there appears to be a spike in Georgia's new cases. While in Sweden, daily new cases continue to plateau with a potentially larger surge in the midst.
Want to READ MORE?
COVID-19 Part 5: Massachusetts Tops New York in Number of Daily New Cases Per Capita
COVID-19 - Part 3: The Inflection Point
COVID-19 - Part 2: New York is the Epicenter of the World
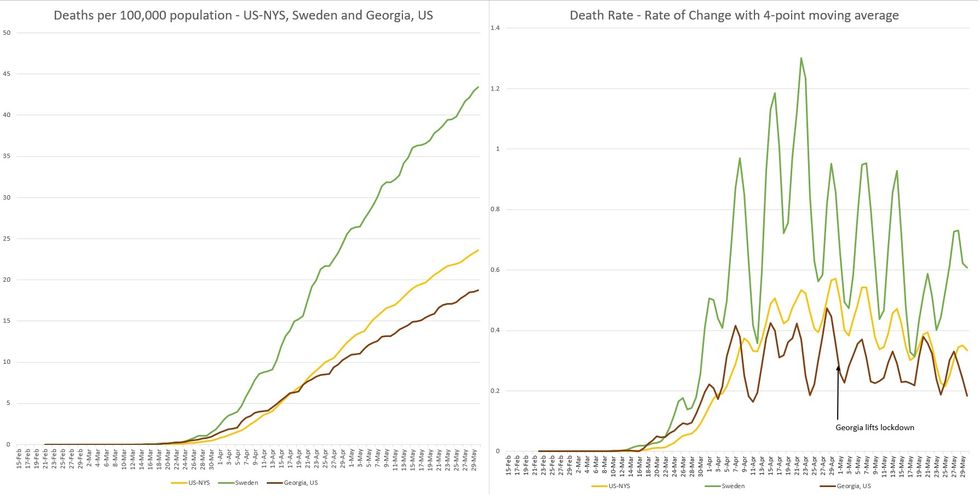
COVID-19: Tracking the Changes
Figure 2 shows that for "The Rest of the United States" (US minus NYS or US-NYS), the maximum number of daily deaths occurred on 4/29 - 42 days after the start of social distancing, and this number continues to fall. In Georgia, daily deaths peaked on 4/27, 20 days after their peak of daily new cases. However, a more recent, lower peak appears on 5/22 - 3 weeks after lifting restrictions.
For Sweden, the maximum number of daily deaths (and new cases) occurred on 4/23 - 25 days after the start of their light social distancing measures. Since then these numbers have not shown a clear pathway to resolution, with the latest surge being larger than the previous one.
Sources of data: Worldometer.com, Georgia Department of Public Health,https://en.wikipedia.org/wiki/COVID-19_pandemic_in_the_United_States
- COVID-19 Part 5: Massachusetts Tops New York In New Cases ... ›
- COVID-19 Update: New York and Mass. Continue to Improve ... ›
- Charities You Can Donate to During COVID-19 - Liberty Project ›