

Much of the media continues to report absolute number of cases by location, which is misleading because a location’s population matters in terms of what’s known as local severity.
This is better described as case density, or the number of cases per capita. For example, if 10 out of 50 people were infected on a small grass field, the case density would be 20%. If 25 out of 500 people were infected on a larger grass field, the case density would be 5% even though there are more cases.

Therefore, even though 2.5 times more people were infected on a larger grass field, the case density would be 4 times less, and therefore the local severity would be less critical. The same is true for deaths per capita. With that in mind, here are the updated charts.
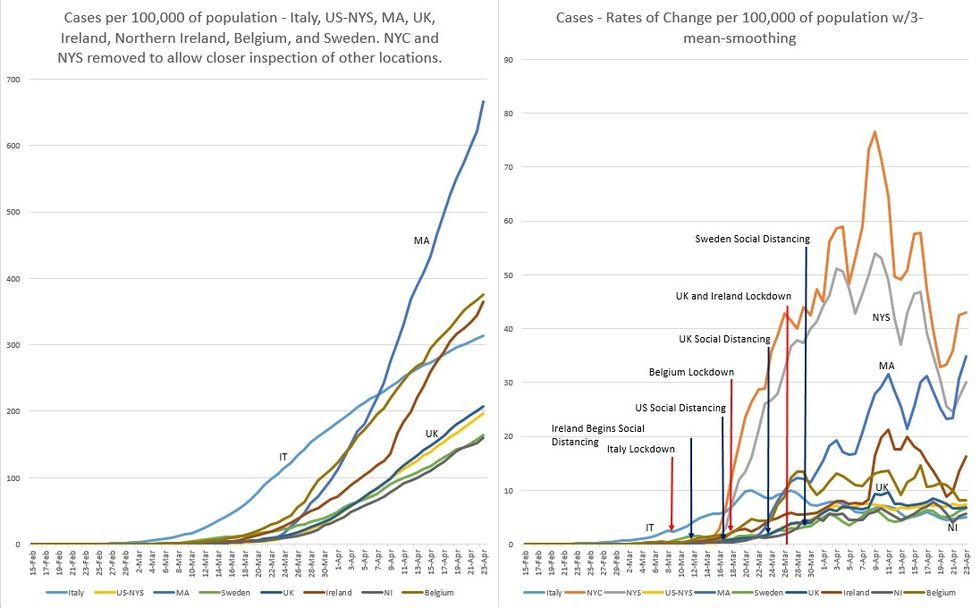
Figure 1: On a per 100,000 population basis, the rises for New York City and New York State are quite steep. When plotted with other locations, the plots of the other locations are squashed significantly and misrepresent the actual condition. Therefore, the plots of NYC and NYS have been removed for the sake of clarity. However, for the rates of change chart, NYC and NYS plots remain as they don’t obscure the other plots significantly.
On the left of Figure 1, we see that Massachusetts is experiencing the largest surge in cases so far. It is said that Massachusetts may soon become the new epicenter of case growth in the US.
But to maintain perspective, NYS still carries 31% of all cases in the US and 9.9% of all cases in the world. By contrast, Massachusetts carries 5.2% of all cases in the US and 1.7% of all cases in the world. However, case density in Massachusetts has surpassed that of “The Rest of the US” (US-NYS) by more than a factor of 3, but less than half of NYS.
On the right of Figure 1, the number of daily new cases in Italy peaked on March 21st, 12 days after their lockdown with daily cases continuing to fall over the last 33 days. For NYS and NYC, the number of daily new cases peaked on April 9th, 23 days after social distancing began, and has continued to fall over the last 2 weeks.
For the UK, the number of daily new cases peaked on April 11th, 15 days after lockdown but 19 days since increasingly stringent social distancing began. This downward trend has been ongoing over the last 12 days.
For Ireland, the number of new cases peaked on April 11th but is currently escalating again. Belgium’s number of new cases peaked on April 16th, but it’s too early to tell if it will increase again. It looked as if Belgium was on a downward trajectory in terms of rates of change, but the country experienced a subsequent surge. The same holds true for Northern Ireland.
Sweden, like Massachusetts, is on a surge, but with much less magnitude.
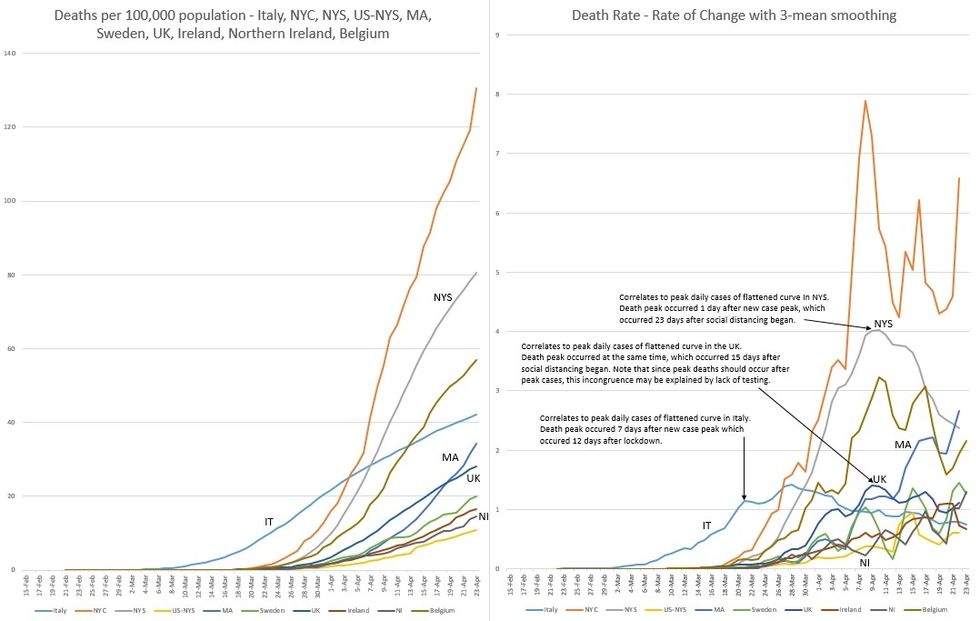
Figure 2 illustrates the relative lag times between the peak of new cases and the peak of daily deaths. The arrows correlate to when the daily peak cases occurred (not the peak of deaths, although they may coincide by chance).
In general, deaths follow cases. One would expect that the peak of daily deaths for any location would arrive after the peak of daily new cases. This is true for Italy, where the peak of daily deaths occurred 7 days after the peak of daily new cases, which in turn occurred 12 days after lockdown. 19 days of lockdown were required to lessen Italy’s death rate.
The UK needed 15 days of lockdown to simultaneously reduce both the number of daily new cases and the death rate. This could be because the UK may be under-testing, resulting in a delay of the peak of daily new cases.
It’s also conceivable that the peak of new daily cases can arrive after the peak of the daily death rate. Further support for this notion is the fact that Ireland has a higher case density than the UK, yet the UK has a higher number of deaths per capita.
NYS required 24 days of social distancing to reduce the death rate; a reduction which occurred 1 day after the peak of daily new cases. Again, this could be due to the lack of testing. In NYC, deaths are on the rise again but to an unknown extent. The same is true for Massachusetts, Northern Ireland, Belgium, and Sweden. It’s too early to tell what will happen in Ireland.
For “The Rest of the US,” the death rate peaked 8 days ago, 29 days after social distancing was instigated.
Sources of data: Worldometer.com, Spectrum News NY1, New York State Department of Health, Massachusetts Department of Public Health, HSC Public Health Agency
- COVID-19: Tracking the Changes – Liberty Project ›
- Tekashi 6ix9ine Is Afraid of Dying from Coronavirus in Prison … ›
- COVID-19 Update: New York and Mass. Continue to Improve – Liberty Project ›