
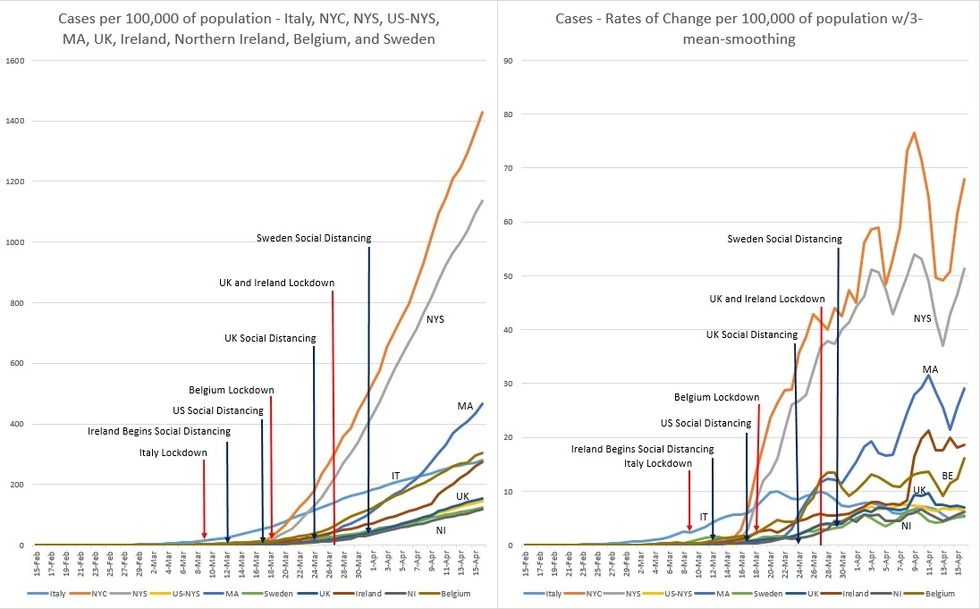
One notices, however, that in Figure 1 for NYC and NYS, a low and flat trajectory is seen from early February and continues until March 16th, when suddenly the trajectory begins to steepen. This is called the inflection point of the curve and will be described in Figure 2.
In Figure 2, locations other than NYC, NYS, and US-NYS (US minus NYS) have been removed. Social distancing began on March 17th. Note that in prior charts, social distancing for the US was lumped with that of the UK. But, after reviewing history, the US actually began social distancing a week earlier. (This has been corrected on subsequent charts.)
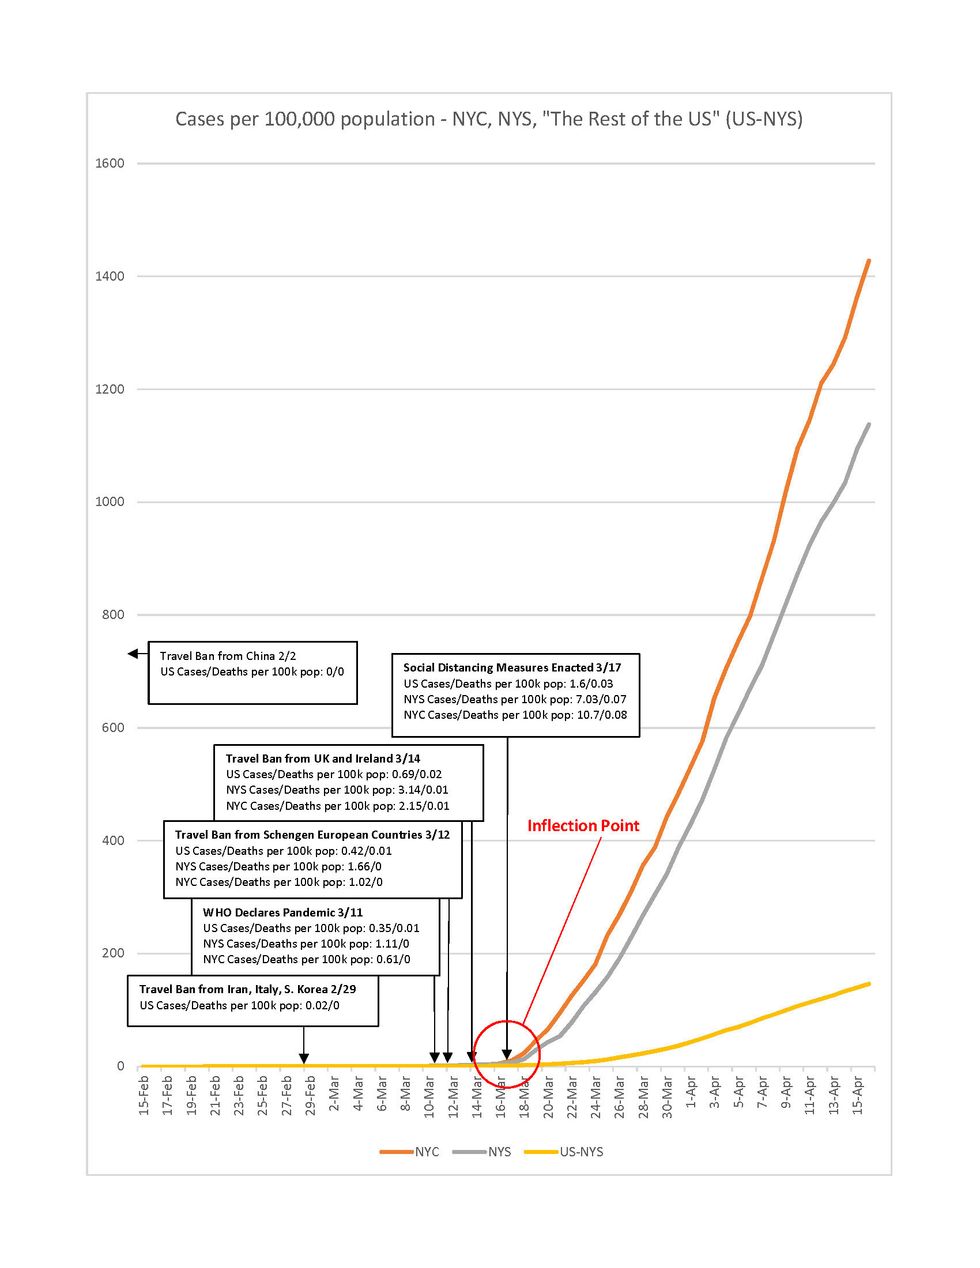
Figure 2 presents milestones that show when certain measures were enacted and what the number of cases and deaths were at that time, on a per 100,000 population basis by location. The inflection point represents a small window of opportunity to make a quick decision on mitigation.
Here are the events leading up to and around the inflection point:
2/2/20: Travel ban from China
2/29/20: Travel ban from Iran, Italy, and South Korea
3/11/20: World Health Organization declares COVID-19 a pandemic
3/12/20: Travel ban from Schengen European Countries*
3/14/20: Travel ban from UK and Ireland
3/17/20: Social distancing and restrictions start
3/19/20: Travel restrictions from Japan (not shown in Figure 2)
3/19/20: Increased testing in New York (not shown in Figure 2)
As far as the other locations seen in Figure 1, we can see that Italy continues to decrease in daily new cases, Ireland and Belgium have seen spikes in new cases. Massachusetts and NY continue to see waves of new cases that overall seem to be increasing in magnitude, while the rest of the locations continue on low and flat trajectories.
New York State continues to be the epicenter of the world, with 33% of all US cases and 10% of all cases globally.
Sources of data: Worldometer.com, Spectrum News NY1, Massachusetts Department of Public Health, HSC Public Health Agency
*The Schengen Area is composed of 26 European states that have officially abolished passports and all other types of border control at their mutual borders.
- 5 Ways to Help Others During the Coronavirus Pandemic – Liberty … ›
- Myth or Fact: Ibuprofen Can Make COVID-19 Symptoms Worse … ›
- What Is Hantavirus and Should We Be Worried About a New … ›
- The Wildest Online Conspiracy Theories About the Coronavirus … ›
- COVID-19 Reveals How Fragile American Society Has Become … ›
- COVID-19 Marketing Emails Are the Newest Form of Art – Popdust ›
- COVID-19 Update: New York and Mass. Continue to Improve – Liberty Project ›
- COVID-19 Update: Mass. Tops New York in Daily Casualties – Liberty Project ›