
Beyond that, she recently announced her third album, HIT ME HARD AND SOFT, to be released May 17, 2024. She spent the days leading up to the announcement building excitement by adding all of her Instagram followers to her “Close Friends” list. Eilish had the most Instagram followers in 48 hours…with her count increasing by 7 million followers total.
While her debut album, when we all fall asleep…where do we go?, was a chart-topper in its own right, it landed Billie every GRAMMY it was nominated for at the ripe age of 18…Eilish has solidified herself as one of the most revered and sought-after popstars in the world.
Eilish recently caught media attention for quietly revealing her sexuality. In an interview with Variety, she states that she’s always liked girls…and assumed people always knew that. In a viral snippet from her new song, LUNCH, she details a love affair with a girl.
But people don’t only adore Billie for her catchy tracks that consistently top the charts. It’s not just her songwriting ability and unique vocals that keep us hooked. People love her because she’s unafraid to speak her mind.
Whether it be complaining about too many influencers being at an awards show, or calling out other artists for using unsustainable practices…Billie does not hold back.
Billie Eilish On Sustainability

Eilish home
rethinkingthefuture.com
The Eilish home is iconic for many reasons: it’s where Billie and Finneas recorded her debut album, countless other songs, and EPs, in an effort to conserve water there’s no grass, and the roof is covered in solar panels. And being environmentally conscious extends beyond the four walls of their home.
When the hottest young talent is discovered at such an early age like Eilish, record labels are chomping at the bit to sign them. It’s like when a D1 athlete is ready to commit to college…you have your pick.
But what Eilish and her mom, Maggie Baird, were looking for wasn’t about money or label-perks…they were seeking a solid sustainability program. And while that may seem like standard practice, most labels didn’t bring up environmental policies during these meetings at all.
After signing to The Darkroom via Interscope Records, the struggle didn’t stop there. Billie Eilish and her family have been consistent contributors to the fight against climate change.
Maggie Baird has since started Support + Feed, which focuses on the climate crisis and food insecurity. Support + Feed helped Eilish’s 2022 Happier Than Ever tour save 8.8 million gallons of water through plant-based meal service for the artist and crew members.
During Billie’s 2023 Lollapalooza performance, she aided the launch and funding of REVERB’s Music Decarbonization Project – which guaranteed all battery systems used during her set were solar powered. The MCD’s overall mission is to lower – and eventually eliminate –the music industry’s carbon emissions.
But more recently, Billie Eilish called out other artists for releasing multiple versions of vinyls in order to boost vinyl sales. In an interview with Billboard, she says,
“We live in this day and age where, for some reason, it’s very important to some artists to make all sorts of different vinyl and packaging … which ups the sales and ups the numbers and gets them more money and gets them more…”
Artists convince fans to buy different versions of their albums by offering exclusive features on each vinyl. Take Taylor Swift, for example, who released five separate vinyl versions of Midnights, each with a different deluxe “Vault” track.
While Billie may not have been trying to shade one artist in particular, the point is that she’s fed up. After being the rare artist in the industry who go out of their way to remain environmentally conscious, Eilish sets the bar high.
How Eilish’s New Album Is Sustainable

Billie for "Hit Me Hard and Soft"
William Drumm
Social media users were quick to claim Eilish was hypocritical by announcing that HIT ME HARD AND SOFT will have eight vinyl variations. However, each vinyl is made from recycled materials – either 100% recycled black vinyl or BioVinyl, which replaces petroleum used during manufacturing with recycled cooking oil.
This just illustrates that Eilish wasn’t directing criticism towards other artists for using vinyl variants to gain album sales…but she does think there are better ways to do it that benefit the environment without hurting their sales.
How To Interpret COVID-19 Statistics
Mark Twain once observed, "There are three kinds of lies: lies, damned lies, and statistics." Those in the legal profession might say: "There are three kinds of liars: simple liars, damned liars, and experts."
Data can be manipulated and presented to support a specific narrative or a particular conclusion. Because of this, you'd be well advised to seek out and analyze data for yourself, as opposed to allowing others to summarize and present that data for you.
A number of data sources are particularly helpful regarding the COVID pandemic. Instead of relying on others to draw conclusions from raw data, you're better off analyzing for yourself.
Three things really matter in the discussion of COVID-19:
The Infection Rate
The infection rate not only tells us about the spread of the virus; ultimately it informs about the lethality of the coronavirus. Of course, lethality is difficult to measure during an outbreak, especially when so many infections are asymptomatic.
Indeed, a Penn State University study estimates that the number of people infected in March 2020 was 80 times the officially reported number (in other words, there were 8.7 million more infected people in March than reported).
Estimates of lethality vary, but the early projection of 3.4% from the WHO appears to be wildly overstated. Dr. John Ioannidis of Stanford makes the case for a lethality of 0.25%. You can monitor the confirmed infection rate for yourself on a daily basis, including by state, at a helpful site from USA Today that posts data from Johns Hopkins University.
By watching this number – a minimum (as stated by USA Today), due to the great number of asymptomatic and unreported cases – you can correlate the rate of infection with other key metrics.
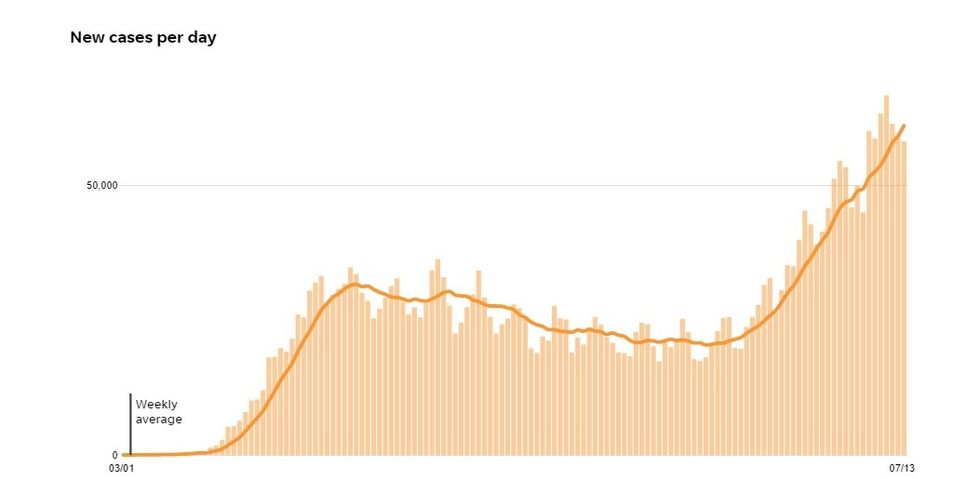
As of today, the new cases curve looks like this:
The Death Rate
Bearing in mind that any death in which the deceased has tested positive for Covid has been classified as a "Covid death" regardless of other contributing factors, you can monitor daily deaths at the same USA Today site.
Safeguarding human life should be our main concern, so please look at the data critically. On June 25th, for example, a spike appears in the data which, after digging through data state-by-state, incorporates results from a retroactive reclassification of ~1,800 deaths in New Jersey as COVID-related.
It's helpful to cross reference with the Worldometer site to identify any large daily discrepancies that could result from retroactive changes. By watching this number, including data concerning state levels, you can begin to correlate the tragic human toll of this disease with infection rate and public policy.
You can also start to draw conclusions as to both lethality and improvements in treatment over time. As of today, the death rate curve looks like this:
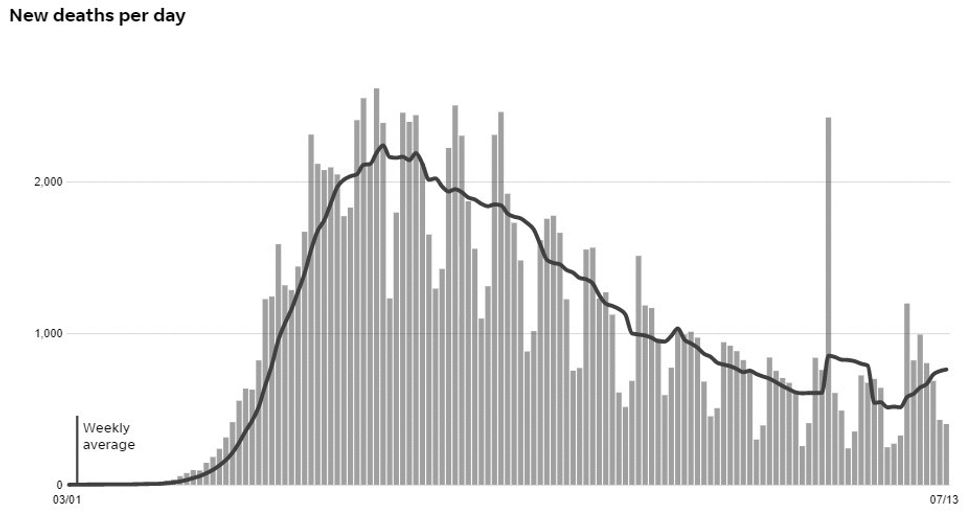 June 25th reclassification of ~1800 deaths by NJ.
The Hospitalization Rate
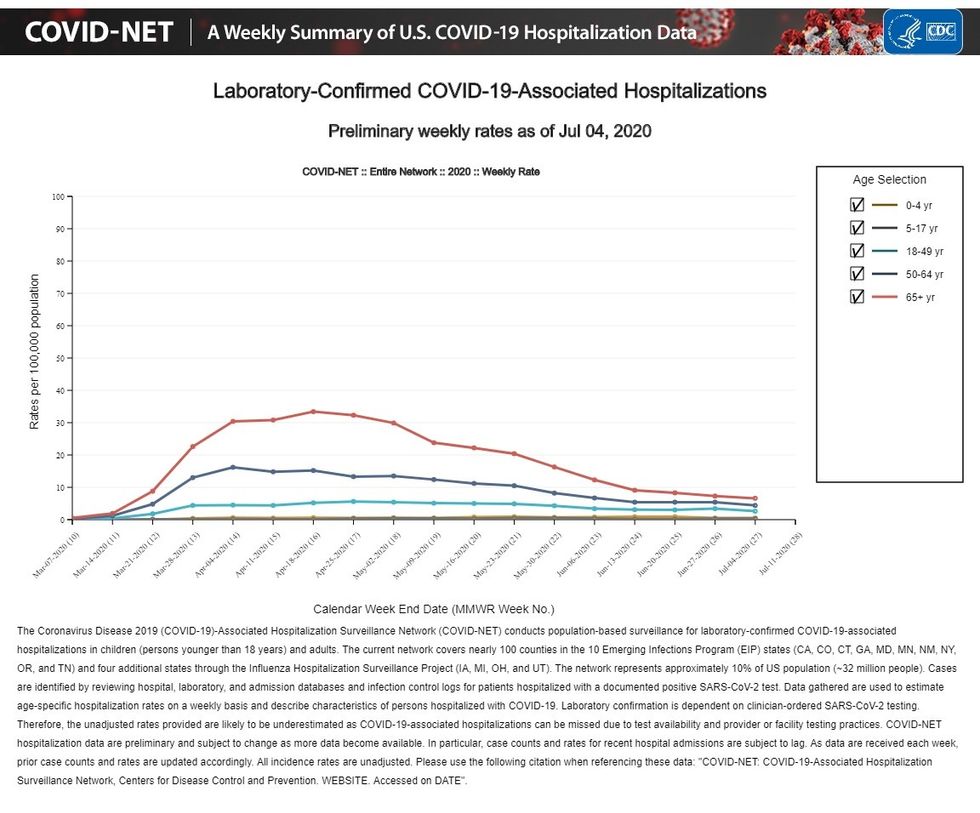
The need to "bend the curve" and avoid overwhelming our hospitals initially drove the lockdown strategy. So, understanding the actual rate of hospitalization nationally remains very important. The CDC publishes that rate on a weekly basis, helpfully sorted by age group.
As of July 4th the hospitalization curve looks like this:
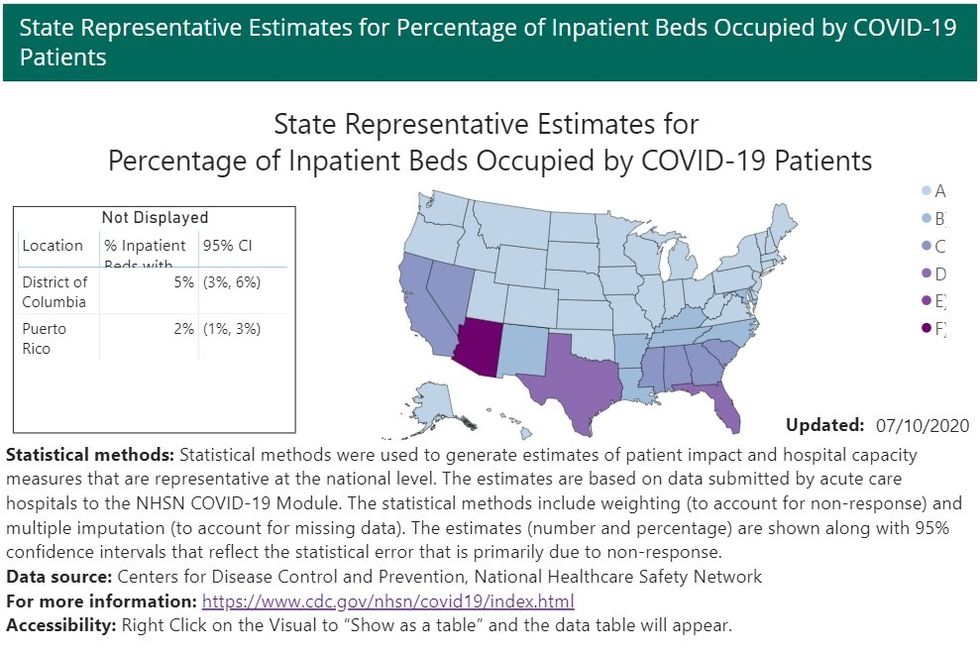
In addition, the CDC publishes state by state data with regard to hospitalizations so you can see the situation on the ground. As of July 10th, Arizona has an in-patient COVID occupancy of 28.4%, followed by Texas and Florida at 16% each.
The national picture looks like this:
Realize that these important metrics only take into account the COVID variable itself; they don't deal with the economic and collateral public health consequences of public policy. As public health officials - such as Dr. Fauci - clearly state, they don't advise on economics or on the broader impact of health policy recommendations.
I suspect that most people are quite able to judge the impact of policy on themselves, their families, and their communities.
The point of this article is to encourage everyone to take advantage of the information that is readily available - and the above is only a start. You should think critically and form your own opinions.
Obviously, any data set will be a snapshot of a given moment, but it allows you to access that data and monitor it over time.
Margaret Caliente is a professional athlete turned internet entrepreneur and Manhattan-based journalist.